Space Ranger pipelines run on Linux systems that meet these minimum requirements:
- 8-core Intel or AMD processor (32 cores recommended), with support for instruction sets including at least SSE4.2. This includes Intel CPUs released since 2008 (Core i5/i7 or newer) and any AMD CPU since 2011. Future versions of Cell Ranger will require CPUs supporting AVX instructions; Intel and AMD CPUs have supported these since 2011 (Intel Xeon E3/E5 or newer).
- 64GB RAM (128GB recommended)
- 1TB free disk space
- 64-bit CentOS/RedHat 7.0 or Ubuntu 14.04; See the 10x Genomics OS Support page for details.
Space Ranger v1.3 was the last version that supported CentOS/RedHat 6 or Ubuntu 12.04.
The pipeline can also run on clusters that meet these additional minimum requirements:
- Shared filesystem (e.g. NFS)
- Slurm batch scheduling system
In order to run spaceranger mkfastq, the following software needs to be installed:
- Illumina® bcl2fastq: bcl2fastq must be version 2.20 or higher.
- Space Ranger runs with
--jobmode=localby default, using 90% of available memory and all available cores. To restrict resource usage, please see the--localcoresand--localmemflags forspaceranger count. - Many Linux systems have default user limits (ulimits) for maximum open files and maximum user processes as low as 1024 or 4096. Because Space Ranger spawns multiple processes per core, jobs that use a large number of cores can exceed these limits. 10x Genomics recommends higher limits.
| Limit | Recommendation |
|---|---|
| user open files | 16k |
| system max files | 10k per GB RAM available to Space Ranger |
| user processes | 64 per core available to Space Ranger |
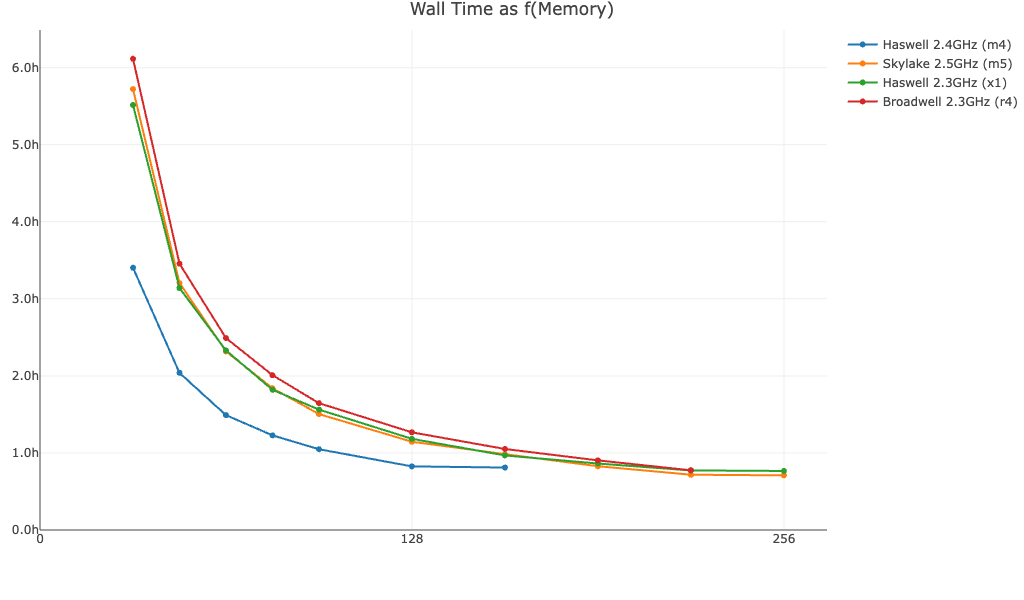
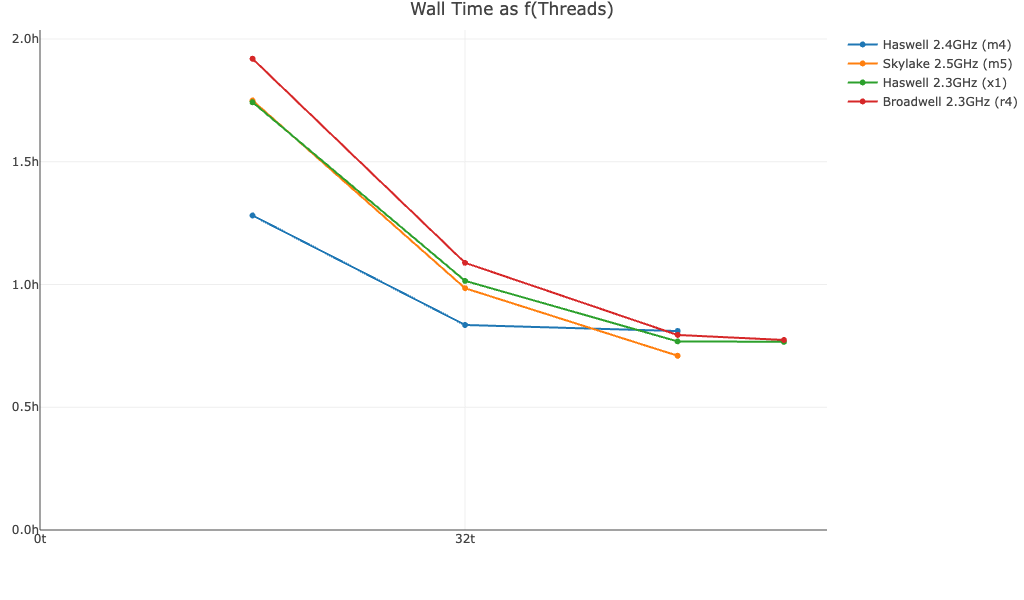
The following plots are meant to convey how increasing memory and cores/threads may impact runtime for spaceranger count (v3.0) based on time trials using Amazon EC2 instances. Observed performance will be impacted by other factors, including library type, read depth, and I/O.
Shown below is spaceranger count wall time (Y-axis) as a function of memory (X-axis) for a Visium HD dataset (268 million reads) across four EC2 instance types:

This plot shows spaceranger count wall time (Y-axis) as a function of threads (X-axis) for the same dataset:
